Case examples
Real AIRAscore analysis reports for typical conditions. Choose a case and page through the report.
Early Alzheimer's disease
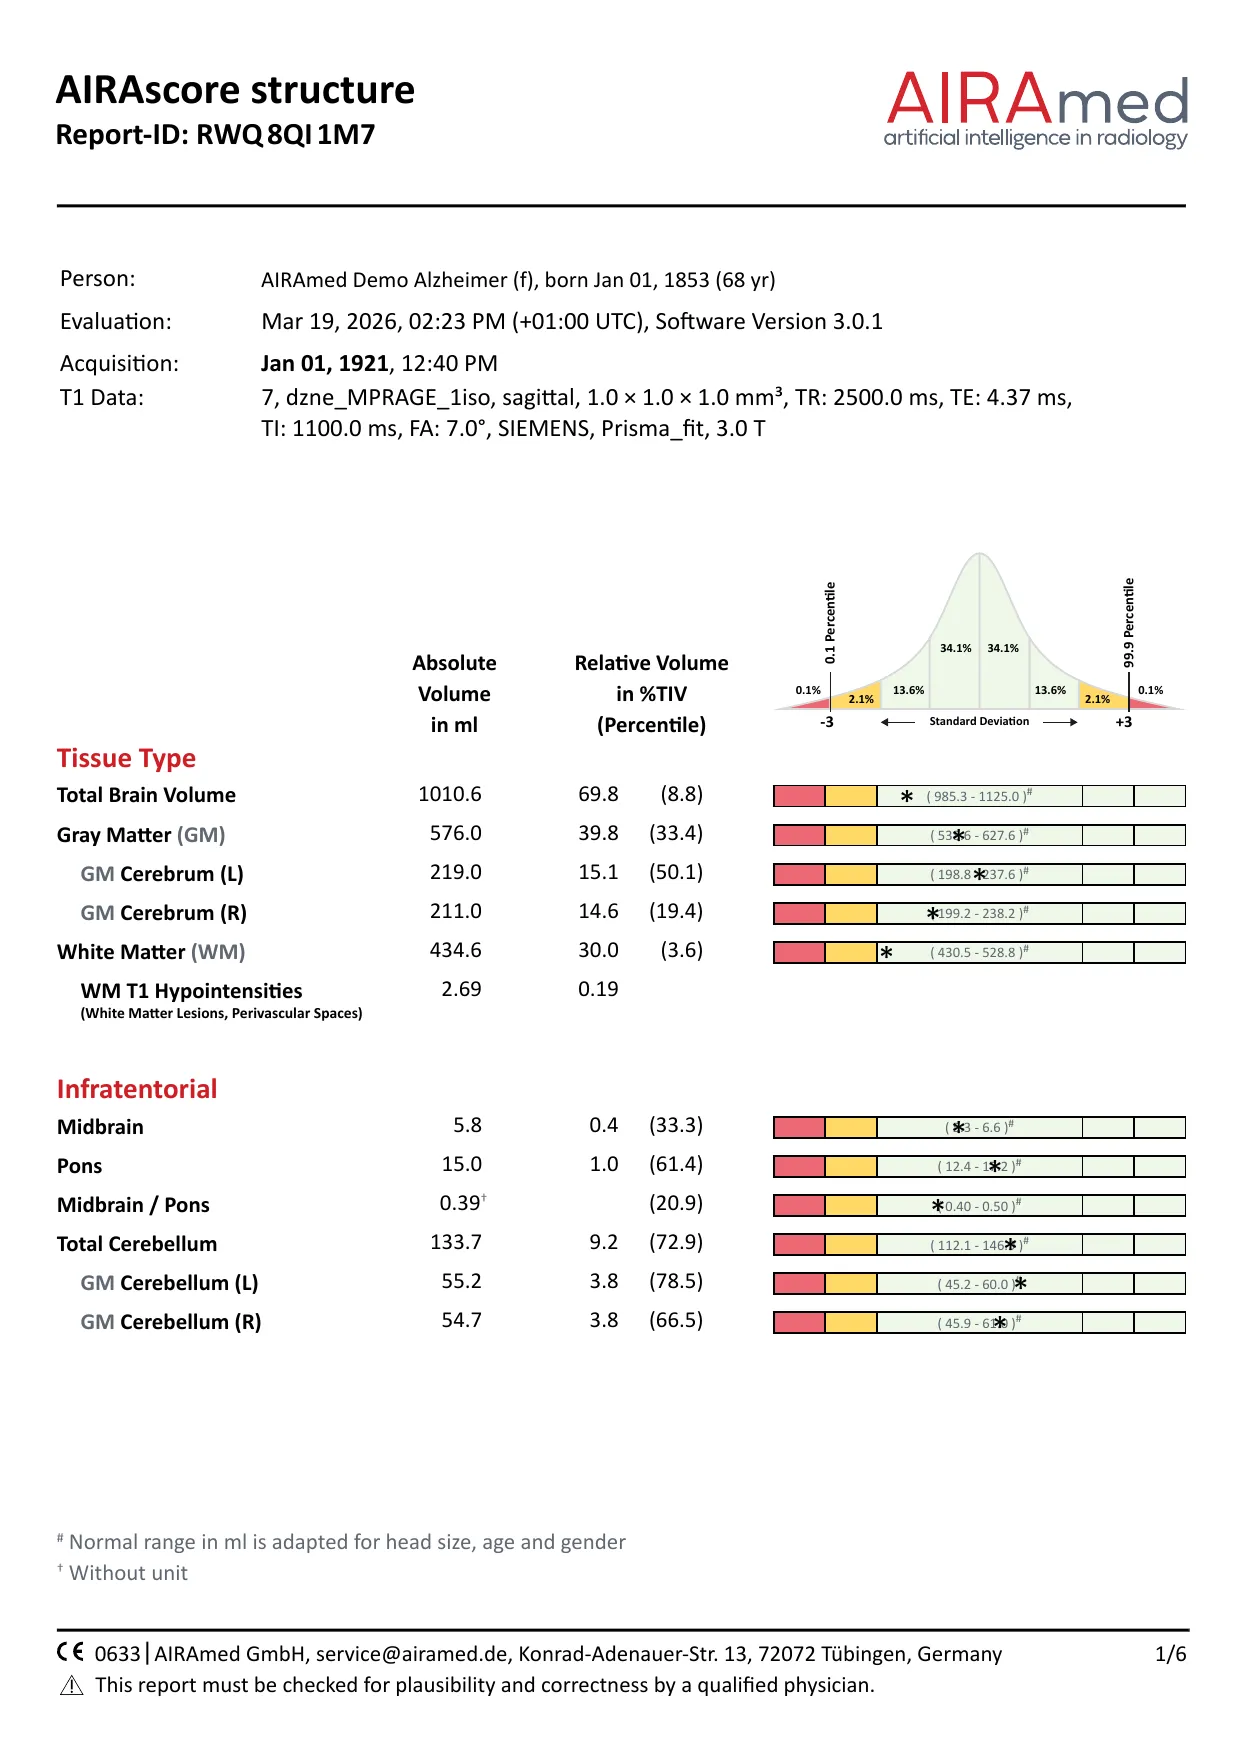
Hippocampus and amygdala on both sides, right temporal lobe reduced
Abnormal values in this case
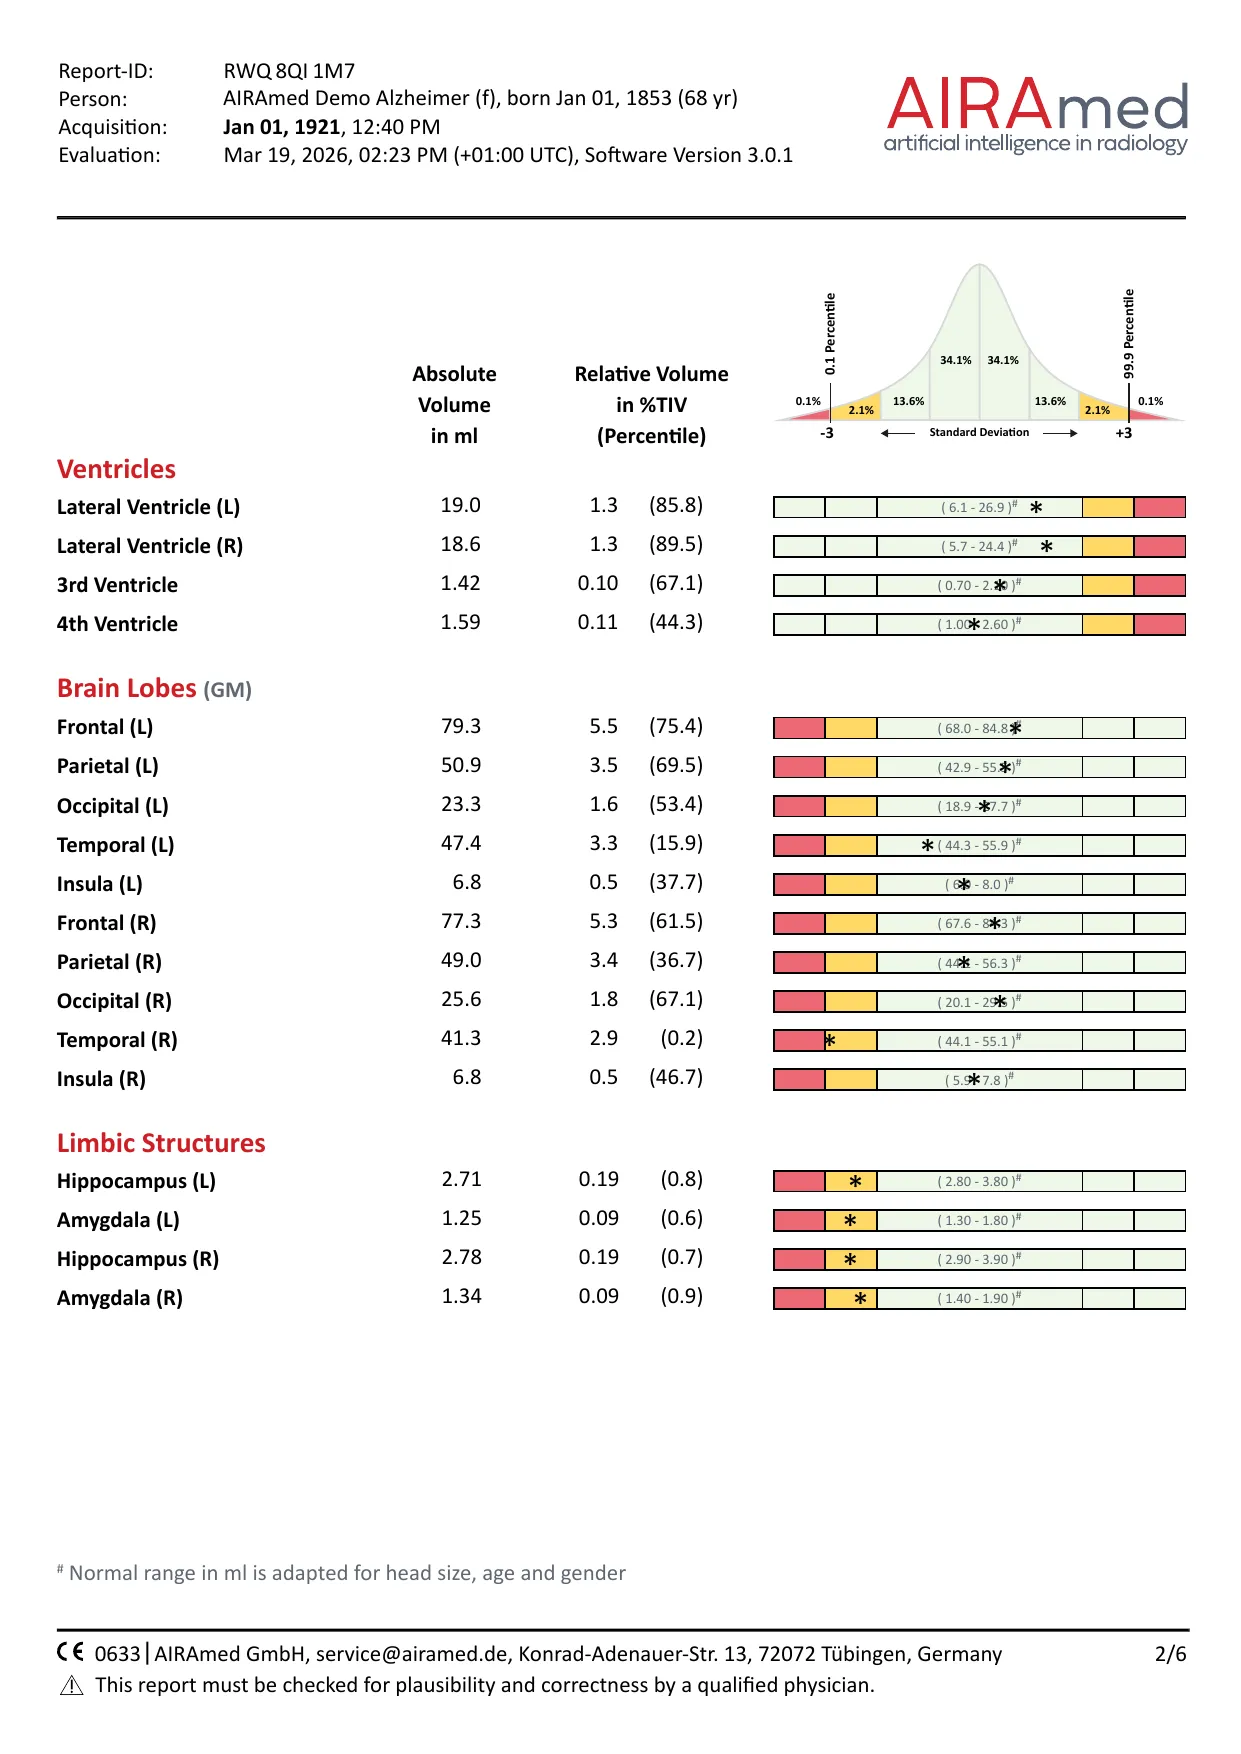
- Temporal (R) percentile 0.2
- Hippocampus (R) percentile 0.7
- Hippocampus (L) percentile 0.8
- Amygdala (L) percentile 0.6
- Amygdala (R) percentile 0.9
The volume loss mainly affects the medial temporal lobe, with hippocampus and amygdala on both sides, plus the right temporal lobe. Frontal, parietal and occipital lobes are within the normal range. Medial temporal lobe atrophy is a marker of Alzheimer’s disease, already at the stage of mild cognitive impairment.1,2 When hippocampus and amygdala are clearly more affected than the rest of the cortex, this fits the limbic-predominant form.3 Such patterns are typical tendencies. Overlap and mixed pathology occur, so the pattern is always read together with the clinical picture and other findings.
female, 68 years · Software 3.0.1 · Siemens Prisma fit 3 T
Page 1 of 6
Tissue classes and infratentorial structures
The header holds the order ID, the time of the MRI scan and of the analysis, the software version and the key sequence parameters. Below, each structure is listed as absolute volume in ml and as a share of the total intracranial volume (%TIV) with its percentile. The bar shows the normal range, corrected for head size, age and sex, and the asterisk marks the measured value.
AIRAscore structure

Page 1 of 6
Tissue classes and infratentorial structures
The header holds the order ID, the time of the MRI scan and of the analysis, the software version and the key sequence parameters. Below, each structure is listed as absolute volume in ml and as a share of the total intracranial volume (%TIV) with its percentile. The bar shows the normal range, corrected for head size, age and sex, and the asterisk marks the measured value.

Page 2 of 6
Ventricles, lobes and limbic lobe
All lobes including the insula are measured separately for each side, plus hippocampus and cingulate gyrus. Together they support early and differential diagnosis and follow-up of diseases with regional volume loss. For the ventricles an enlargement is abnormal, so yellow and red sit on the right there.

Page 3 of 6
Deep grey matter
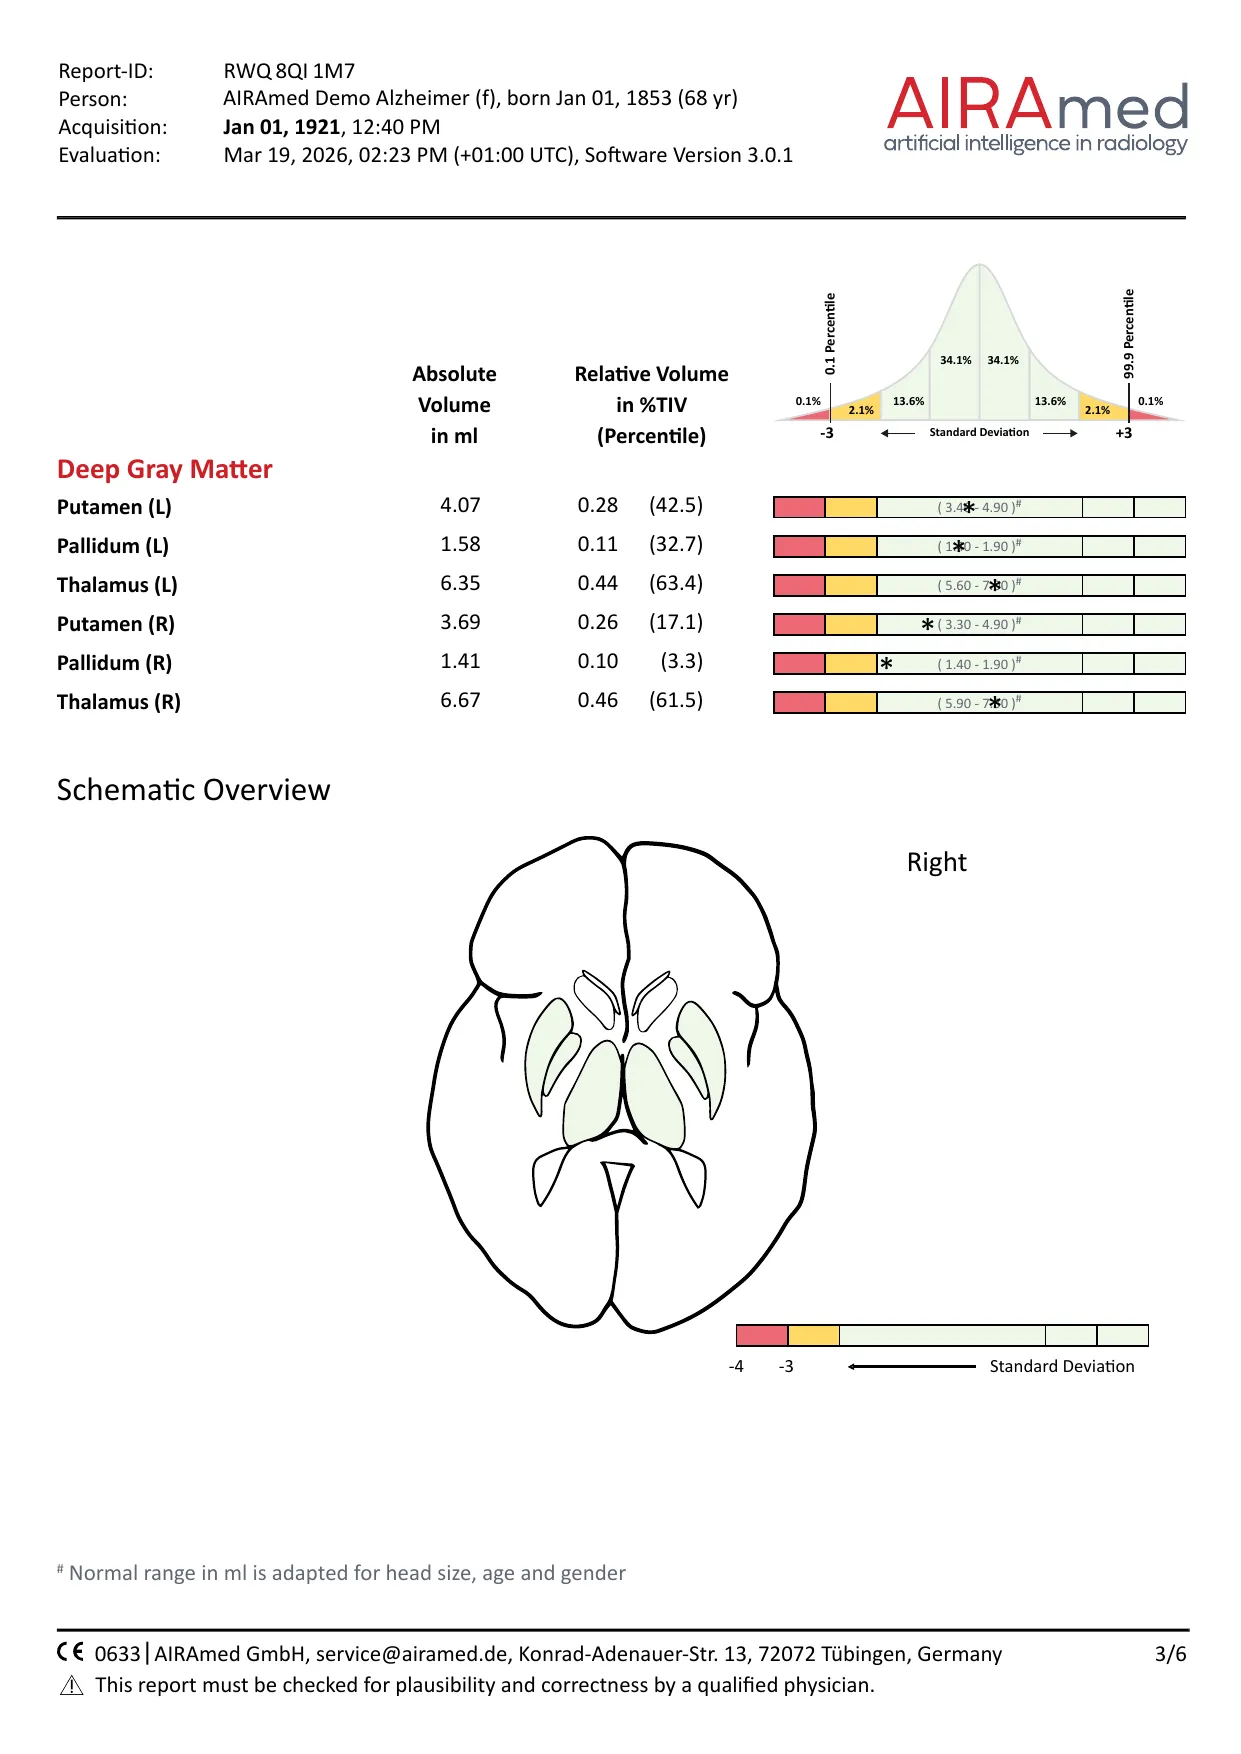
Putamen, pallidum and thalamus are measured separately for each side. The axial diagram below shows where these nuclei and the ventricles deviate from the normal range.

Page 4 of 6
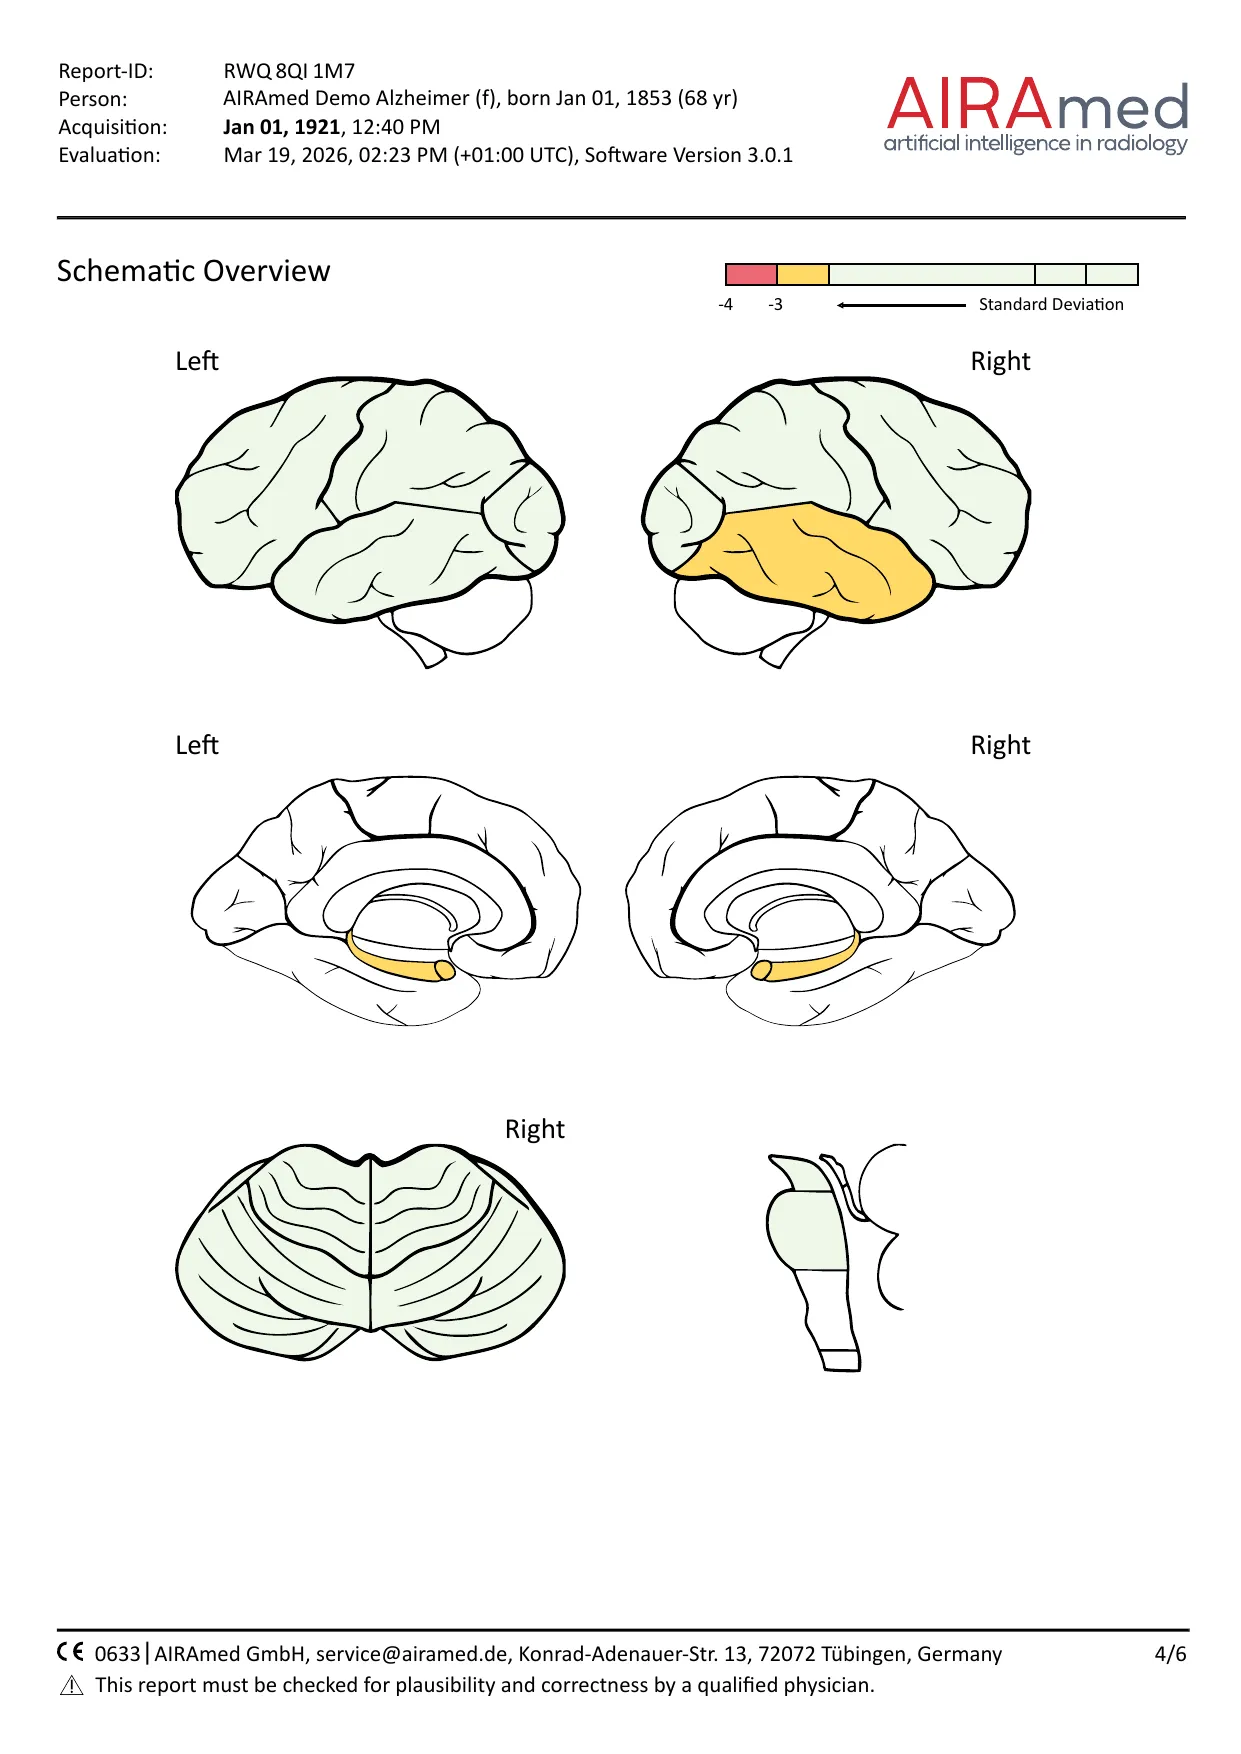
Pictogram of volume loss
The pictogram shows where volume is reduced. Green: within the normal range. Orange: only 2 in 100 people of the same age and sex have a comparable value. Red: only 1 in 1000.

Page 5 of 6
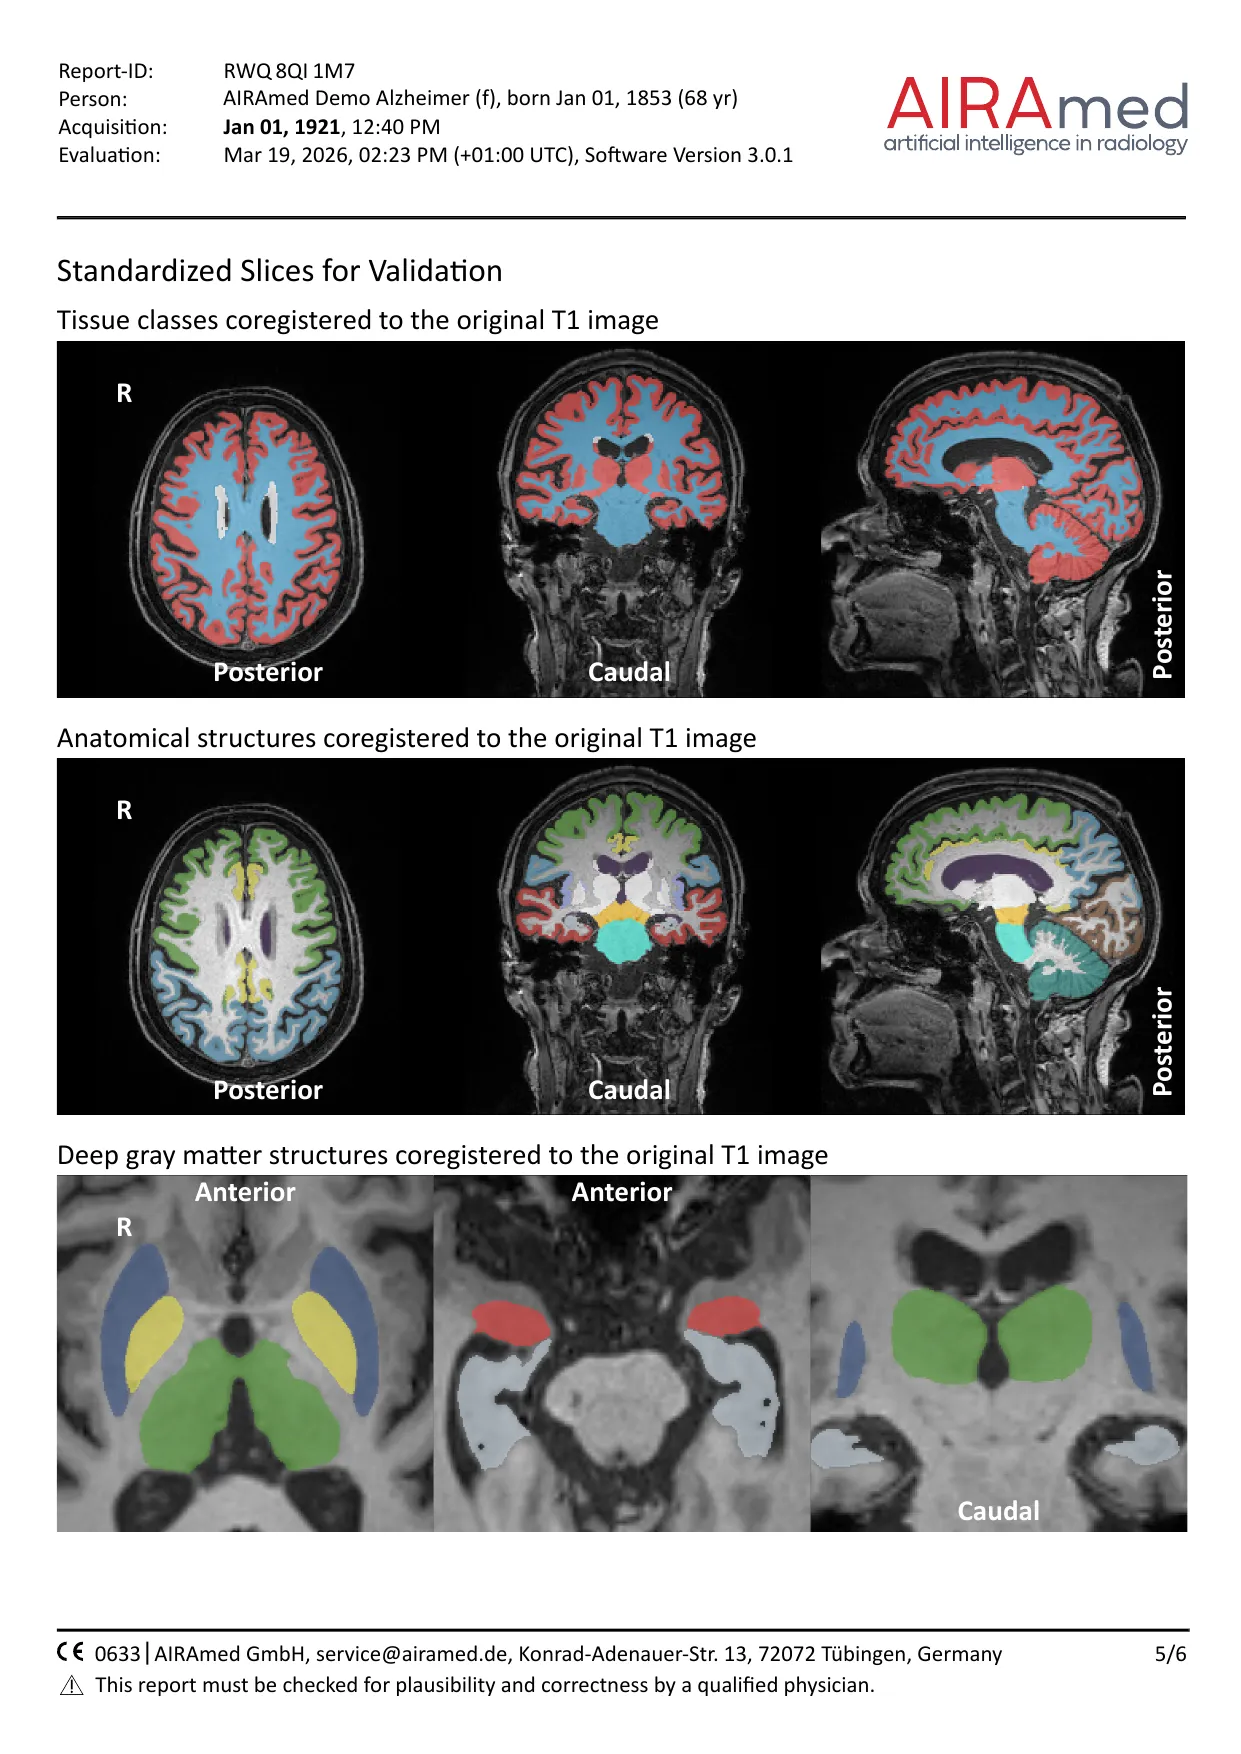
Validation on standardised slices
The segmentation is shown on the original T1 images, so its plausibility can be checked right in the report. In addition, the whole segmentation is returned as separate DICOM series, so every voxel can be checked.

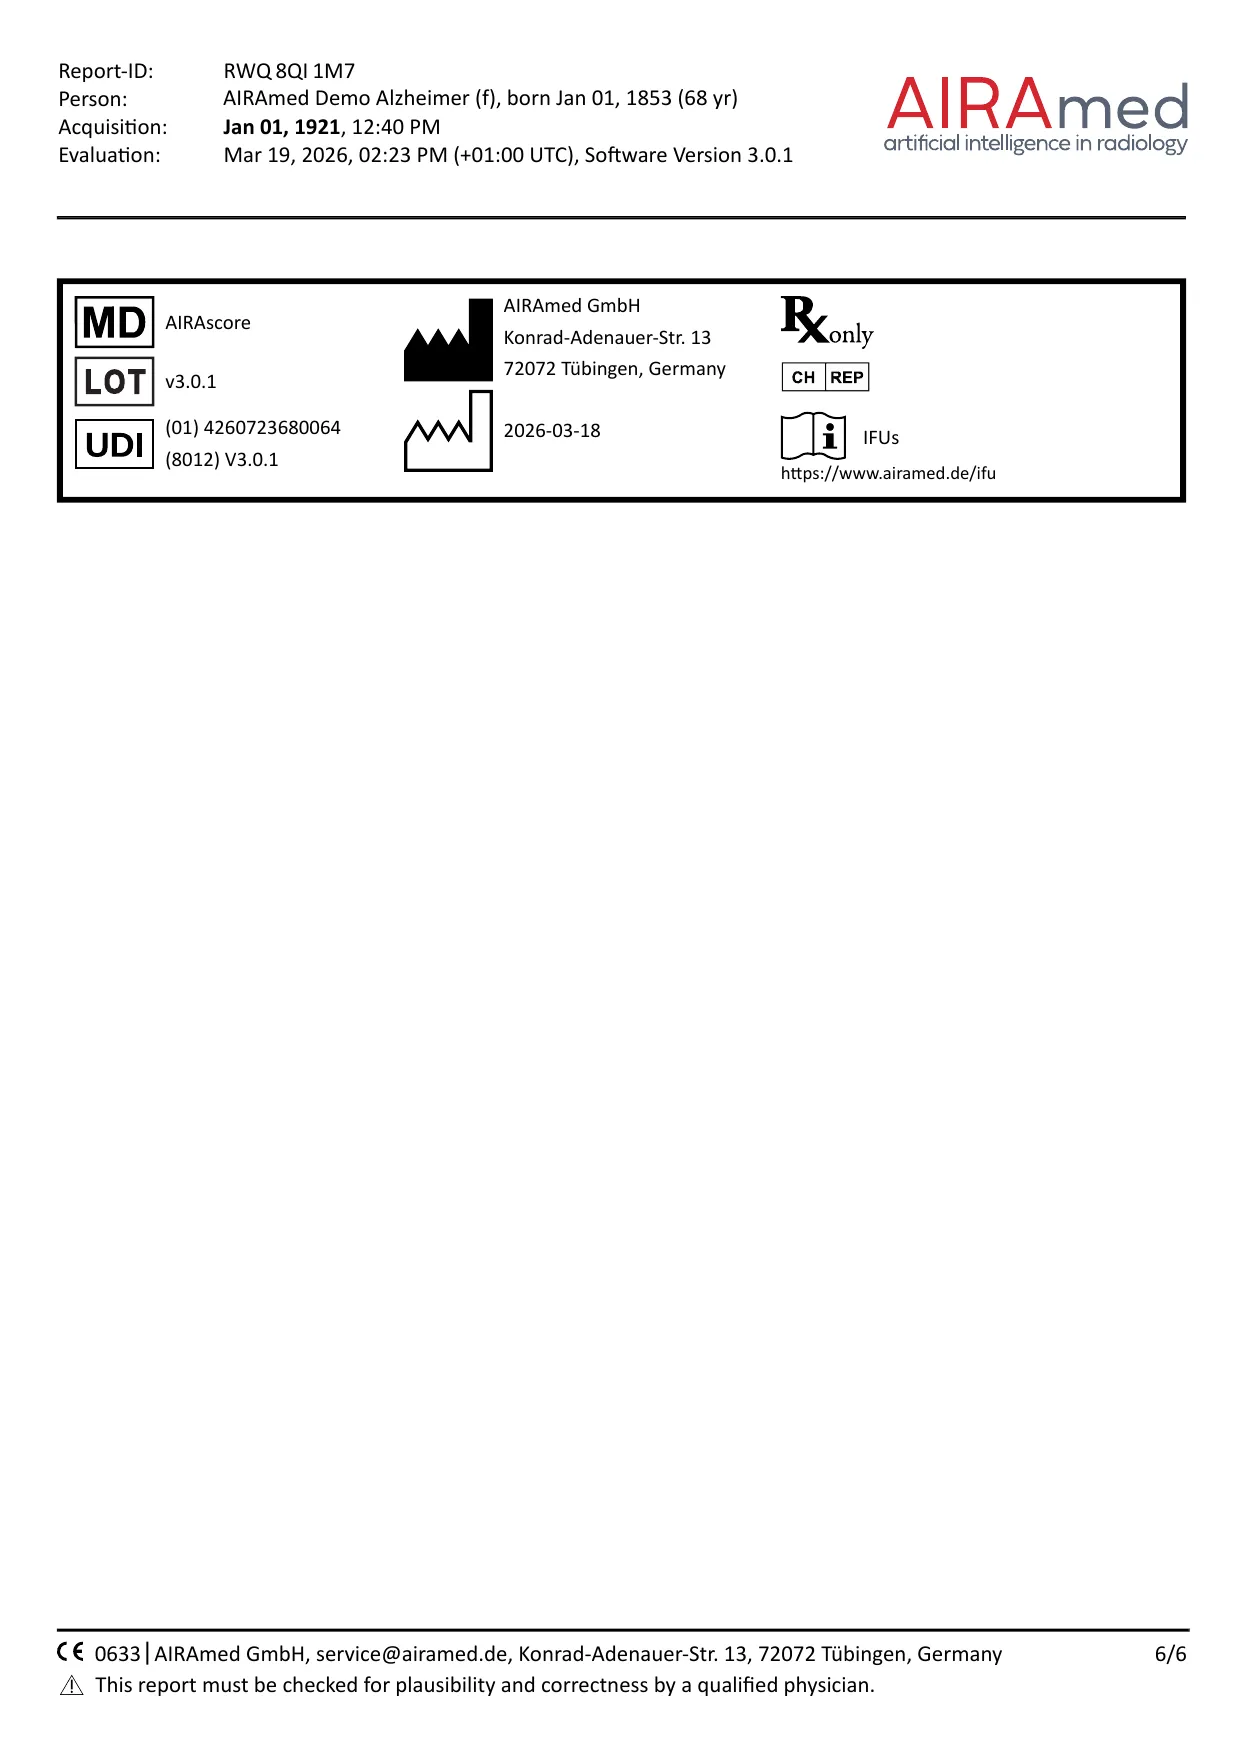
Page 6 of 6
Label
The last page carries the medical device label: software version, UDI, manufacturer, date of manufacture and the reference to the electronic instructions for use.
The results of an analysis report must be checked for plausibility and correctness by a qualified physician (specialist) before clinical assessment. The reports come from software version 3.0.1. The current version is 3.1.0.